
Redoing in the office what was already done in the field
Nobody times the second half of an inspection. This is what is measured about administrative rework, and what still is not.
35 %
of time spent on non-productive activities, as declared by some 600 professionals (FMI and PlanGrid, 2018).
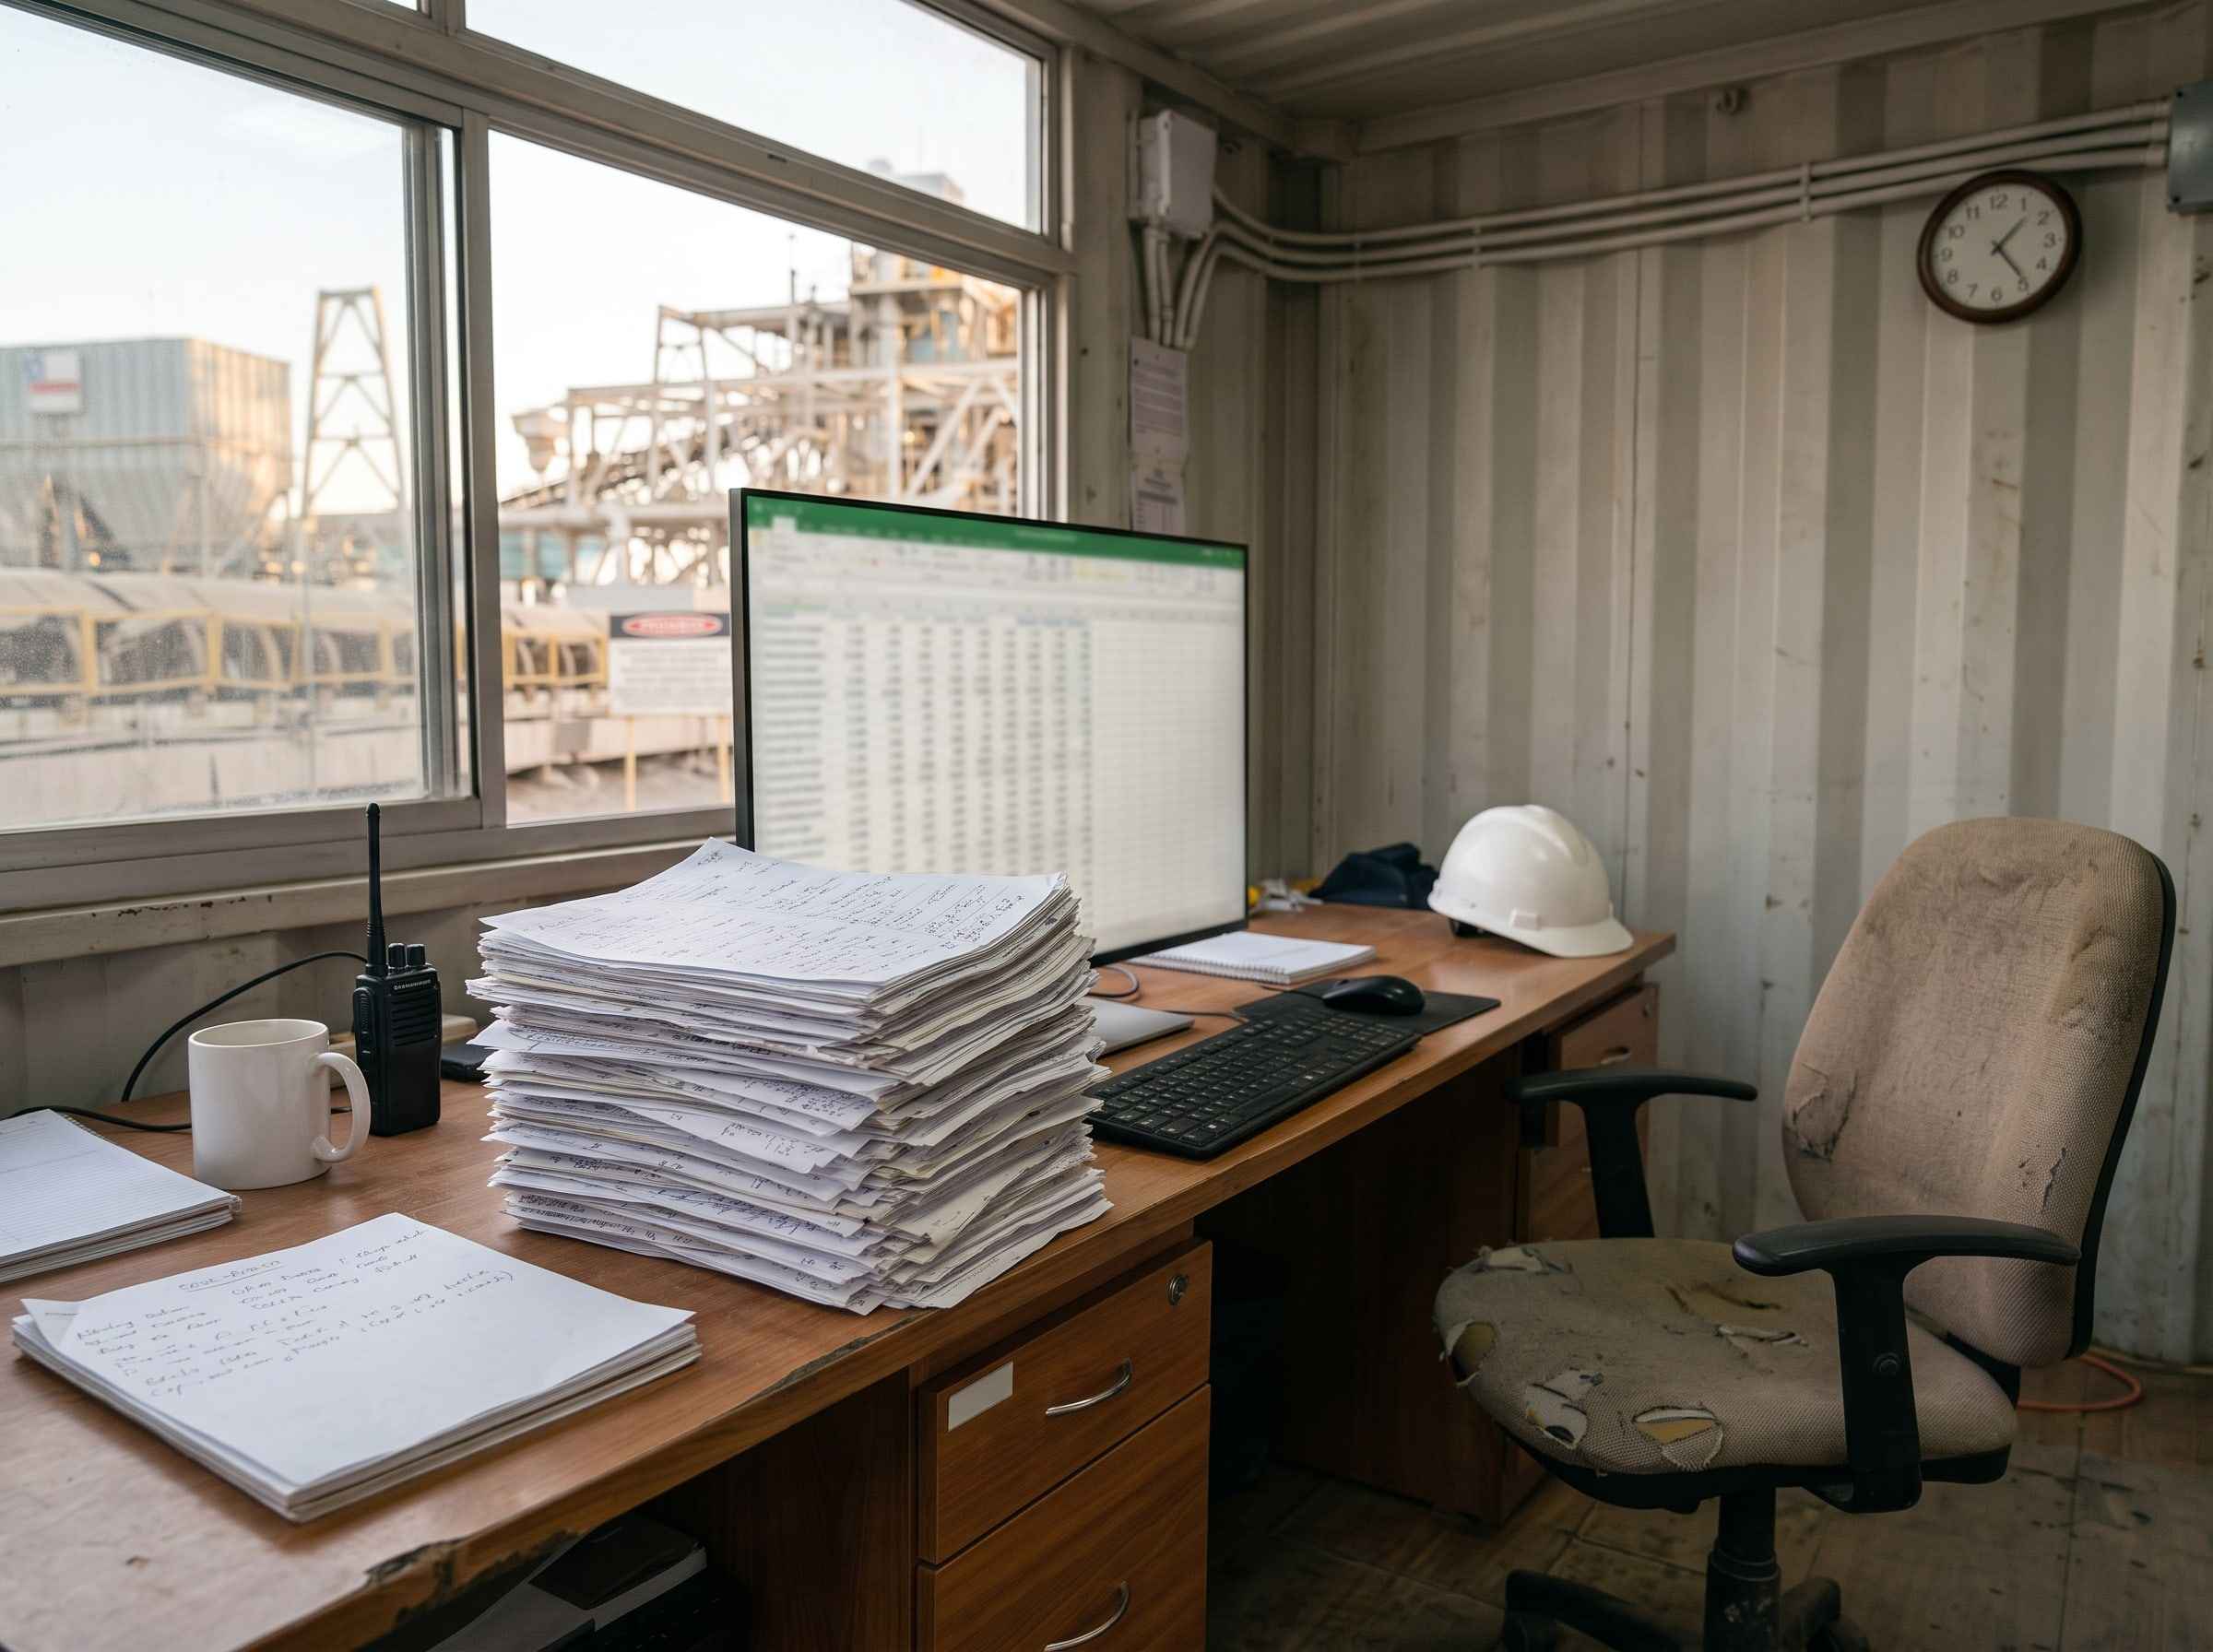
An inspection seems to end when the last sheet is signed in the field. In practice a second working day starts there, in an office and several days later: somebody transcribes the handwriting, looks for the photograph that belongs to that finding, calls to ask what the illegible field said and assembles the report. That half of the work is almost never timed, and that is why it almost never shows up in what an inspection is believed to cost.
We set out to find how much of this is actually measured. What follows is what we found, with its source, its date and its limits.
The time
The most cited reference is Construction Disconnected, the report FMI and PlanGrid published in 2018 from a survey of close to 600 construction professionals. The headline finding: respondents say they spend 35 % of their time on non-productive activities, more than fourteen hours a week. Broken down, that is about 5.5 hours looking for project information, close to 5 resolving disagreements and close to 4 dealing with mistakes and rework.
From the same report comes a figure that explains why this keeps happening in 2026: 75 % of the companies surveyed hand phones or tablets to their field people, and only 18 % say the applications are used consistently. Both figures are over the total of respondents: the 18 % is not a fraction of the 75 %. The problem was not buying the device. The numbers and the methodological detail are summarised in Construction Dive’s piece on the study.
It is worth saying what that 35 % is made of: it is a survey, the hours are self-reported, it is construction and the sample is mostly American. It serves to size an order of magnitude. It is not a figure that can be applied to a Chilean site and taken as measured.
The cost of redoing
The classic number on rework comes from the Construction Industry Institute. Its publication SD-29, from 1987, analysed nine industrial projects and found that the deviations that ended in rework, repair or replacement amounted to 12.4 % of the project’s total installed cost —9.5 points attributable to design and 2.5 to construction.
It is a 1987 study of nine projects, and we say so because it matters: it is the reference everybody repeats, and almost nobody mentions the year or the sample size. What it contributes is not the exact figure, which no longer describes today’s industry, but the order: rework is not a rounding error in the budget.
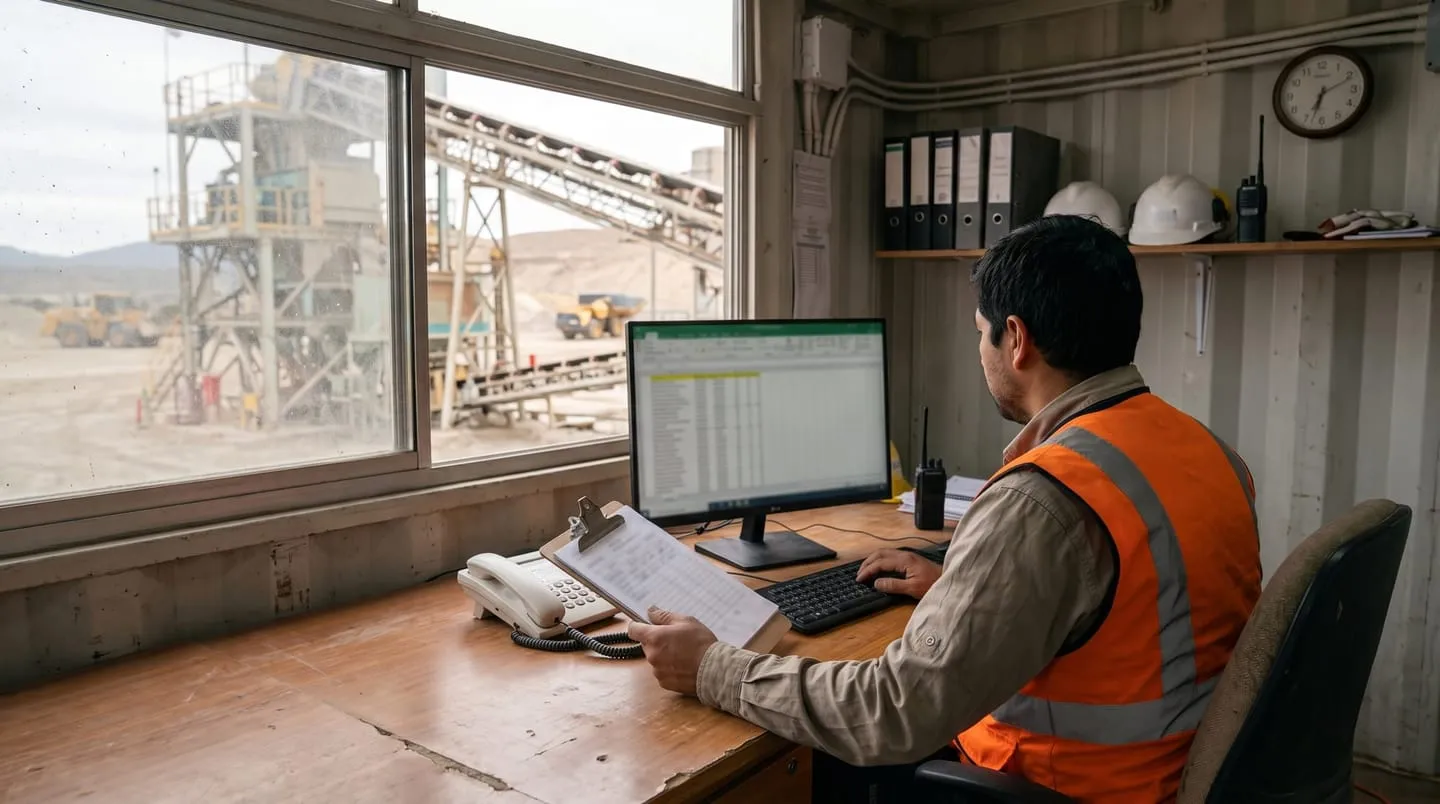
AI-generated image from our own references.
The cost of transcribing
Here there is good literature, and it comes from where you would least look for it: clinical research, which has spent decades measuring how many errors a person introduces when moving data from paper to a database.
A systematic review and meta-analysis —Garza and co-authors, published as a preprint in 2023 and peer-reviewed in 2024— gathered the published error rates by processing method. Per 10,000 fields: single entry ranges from 4 to 650 errors; double entry (two people type the same thing and the system compares) from 4 to 33; and manual abstraction from a chart reaches 70 to 2,784. The pooled rates are 0.29 % for single entry, 0.14 % for double entry and 6.57 % for abstraction. The 93 manuscripts it reviews are from 1978 to 2008, which is the other limit that should be stated.
An earlier study, published in PLOS ONE in 2012 by Paulsen, Overgaard and Lauritsen, measured the same thing on a real questionnaire: 0.370 errors per thousand fields with single entry, against 0.046 with double entry. Eight times more.
What interests us about those numbers is not which is high and which is low. It is where they come from: they are clinical trials, where data entry is audited, protocolised and often duplicated by design. That is the best case. An inspection form typed in an office, among other things, with no second pass and in the handwriting of whoever was on site, is not going to come out better than that.
What we cannot say
We have no measurement of our own of how many hours and how many errors this rework costs on a Chilean site, and we found none published. Everything above is from other industries and other countries.
When we have ours we will publish it the way we publish the rest of our figures: with the sample size, the interval and what the measurement fails to see. In the meantime we would rather go without a number than invent one.
Sources
FMI and PlanGrid, Construction Disconnected (2018), survey of close to 600 professionals: full report · Construction Dive summary.
Construction Industry Institute, Costs of Quality Deviations in Design and Construction (SD-29, 1987): CII record.
Garza M. Y. and co-authors, Error Rates of Data Processing Methods in Clinical Research: A Systematic Review and Meta-Analysis of Manuscripts Identified Through PubMed, International Journal of Medical Informatics (2024), doi 10.1016/j.ijmedinf.2024.105749. The same figures, now peer-reviewed; the full text remains open.
Paulsen A., Overgaard S. and Lauritsen J. M., Quality of Data Entry Using Single Entry, Double Entry and Automated Forms Processing, PLOS ONE (2012): doi 10.1371/journal.pone.0035087.